Manufacturing and Deindustrialisation
Manufacturing and Deindustrialisation: What happened to industrial employment?
Manufacturing exports fell again in May for the 16th consecutive month. This is partly due to an increasing number of EU customers switching to more local suppliers to avoid the customs barriers and paperwork involved in buying goods from the UK. 1 According to the manufacturing organisation, ‘Make UK’ manufacturing output shrank by about 4% last year and is expected to decline again in 2023. Just over 28% of manufacturers say that growth is being held back because of a lack of direction from Government by way of an industrial strategy. A further 60% say that it’s ‘mainly’ the lack of an industrial strategy, but that there are also other factors. From 1979 onwards “the received wisdom in HM Treasury and elsewhere was that the best industrial policy is no industrial policy.” 2
Deindustrialisation can be described “as a trend decline in industrial output and/or employment as a share of all economic activity.” 3 During the period 1950 to 1973 manufacturing output grew at an average annual rate of 3.1%, the highest of all the leading economies. By contrast, between 1973 and 2007 the annual rate of growth of output was only 0.4%. The USA grew by 2%, Germany by 2.1%, France by 2.4%, and Italy by 2.9%.4 In 1979 manufacturing accounted for 23.4% of domestic output, down from 30% in 1970. By the time the Conservatives left office in 1997 it had fallen to 17.1%, and by 2010 when New labour left office it was down to 10%.5 Services on the other hand had grown from 55% in 1970 to 79% in 2010. In 2022 the manufacturing sector accounted for 9.8% of total UK economic output and 8.1% of jobs.6
While the fall in output was substantial, employment fell even more. Around a million jobs in total were lost between 1959 and 1969 in coal, railways, agriculture, textiles and clothing.7 In manufacturing, employment was at its highest level in 1964 when 36.1% of all those employed in Britain worked in manufacturing.8 The IMF has calculated that between 1960 and 2015 manufacturing employment fell by just over 0.4% per year. This was more than any other country apart from Switzerland.9
UK Manufacturing jobs 1978 to 2022 (thousands)
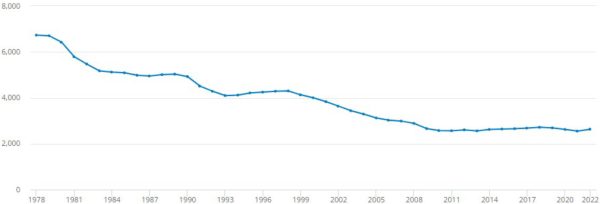
The chart 10 shows the general downward trend of employment in manufacturing from 1978 to the present. During the Conservative years manufacturing employment fell from 6.7 million in 1979 to 4.29 million in 1997, a fall of 2.41 million. By the time New Labour left office in 2010 the number employed was 2.57 million, a fall of 1.72 million. As the chart shows employment in manufacturing continued to fall reaching its lowest point in 2013 at 2.56 million. Since then it has stabilised and increased slightly to 2.63 million in 2022.
The speed of the fall was especially fast in the years 1979-83, when over two million jobs in industry and 1.7 million in manufacturing were lost.11 During these years unemployment in the West Midlands increased from 4.2% of the working population to 12.2%. In Wales unemployment rose from 5.7% to 12.4%. In Scotland between 1979 and 1981 unemployment increased from 6.2% to 10.4% of the workforce. Total numbers of unemployed continued to rise over the next few years reaching 11.8% or 3.4 million in 1984.12
In 1979 the new Conservative government had reduced the top rate of income tax from 83% to 60% and the basic rate from 33% to 25%. In order to make up for the loss of revenue VAT was increased from 8.5% to 15%. This had a dramatic effect on inflation. From an average of 8.3% in 1978 inflation increased to 13.4% during 1979. By 1980 it had risen to 18% although it subsequently fell to 12% in 1981.13 To counter the high inflation, interest rates were raised substantially. The bank rate, or minimum lending rate as it was called then, reached its highest ever level of 17% in November 1979. It stayed at this level until July 1980 when it fell slightly to 16%. Although it fell again to 14% towards the end of 1980, it was back up to 15% by the end of 1981.14 One economic historian has written that government policies “were poorly thought out, incoherent and pursued with little serious estimate of their likely consequences” and led to “the second worst slump of the 20th century exceeded only by that of 1920–1921.” 15
The high interest rates made London a very lucrative place to deposit money, which in turn pushed up the value of the pound. As a result the exchange rate of the pound rose by 45% between the middle of 1979 and January 1981. The high exchange rate meant that exports became much more expensive to buyers abroad, while imports became much cheaper for British buyers. Almost all of British industry lost out either by not being able to sell their goods abroad or by having their goods replaced by cheaper imports, “and this was the core cause of the mass industrial redundancies.” 16
References
- United Kingdom Manufacturing PMI: May 2023 Data, Trading Economics https://tradingeconomics.com/united-kingdom/manufacturing-pmi UK factories blame 16th month in a row of falling exports on Brexit barriers, Guardian 1 June 2023
- Manufacturing Outlook Quarter 1 2023 Make UK/BDO https://www.makeuk.org/insights/reportsmanufacturing-outlook-q4-2022 Industrial Strategy: A Manufacturing Ambition, Make UK 2023, pages 8 and 11 https://www.makeuk.org/insights/reports/manufacturing-outlook-q4-2022 ambition
- Deindustrialisation and Thatcherism: Moral economy and unintended consequences, Jim Tomlinson Contemporary British History, 35:4, 620-642 (2021) page 622 https://doi.org/10.1080/13619462.2021.1972416
- The De-industrial Revolution: The rise and fall of UK manufacturing 1870 – 2010, Michael Kitson and Jonathan Michie, in The Cambridge Economic History of Modern Britain Vol 2 1870 to the Present (2014), pages 310, 312 and 314. This article can also be found at https://www.cbr.cam.ac.uk/wp-content/uploads/2020/08/wp459.pdf
- Changes in the economy since the 1970s, ONS September 2019, Figure 4 Output by sector
https://www.ons.gov.uk/economy/economicoutputandproductivity/output/articles/changesintheeconomysincethe1970s/2019-09-02 6. Manufacturing: Key Economic Indicators, House of Commons Library, March 2023 https://researchbriefings.files.parliament.uk/documents/SN05206/SN05206.pdf - Not ‘Decline and Revival’: An alternative narrative on British post-war productivity, Jim Tomlinson, in Business in Britain in the Twentieth Century, edited by Richard Coopey and Peter Lyth (2009) page 164
- Deindustrialisation and Thatcherism, Table 3 page 622
- World Economic Outlook, IMF (2018) Chapter 3 Manufacturing Jobs: Implications for Productivity and Inequality, chart on page 5 https://www.imf.org/en/Publications/WEO/Issues/2018/03/20/world-economic-outlook-april-2018
- UK Workforce Jobs SA: C Manufacturing, Office for National Statistics (ONS) March 2023 https://www.ons.gov.uk/employmentandlabourmarket/peopleinwork/employmentandemployeetypes/timeseries/jwr7/lms
- Deindustrialisation and Thatcherism, p621
- The Reinvention of Britain 1960-2016: A Political and Economic History, Scott Newton, (2018) page 144
- The World Bank, accessed on 18 May 2023 https://data.worldbank.org/indicator/FP.CPI.TOTL.ZG?locations=GB
- Official Bank Rate History, https://www.bankofengland.co.uk/boeapps/database/Bank-Rate.asp
- Mrs Thatcher’s Macroeconomic Adventurism, 1979-1981, and its Political Consequences, Jim Tomlinson, British Politics (2007) page 4. This article can also be found at https://link.springer.com/article/10.1057/palgrave.bp.4200038
- Deindustrialisation and Thatcherism, pages 627-629 and 635
Notes
The recession of 1979-1982 was made worse by the government’s budget of March 1981. This cut public spending and increased taxes in order to reduce government borrowing. The budget was criticised in a letter to the Times by 364 economists. The letter stated that there was no basis in economic theory or independent evidence for the government’s belief that reducing demand would bring down inflation and lead to an increase in output and employment. “Present policies will deepen the depression” and “erode the industrial base of the economy.” (The Economy under Mrs Thatcher 1979-1990, Christopher Johnson, 1991 pages 44 and 45)
In its report, Industrial Strategy: A Manufacturing Ambition (see Source 2), Make UK, the manufacturer’s organisation describes the essential elements of an effective industrial strategy or policy with the kind of support from government that is necessary if the UK “is to remain competitive in today’s global market.” (see pages 27-38)
Filed under: News